Your Survey Data Is a Goldmine Full of Landmines
Stop guessing. Learn how analysing survey data the right way turns messy customer feedback into actionable growth strategies for your startup.
Posted by
Related reading
Transforming Customer Feedback Analysis with AI in Real-Time
Discover how AI revolutionizes customer feedback collection and analysis, enabling swift, informed decision-making for businesses.
10 Voice of Customer Examples You Can Actually Use
Stop guessing. See 10 real voice of customer examples from surveys, social media, and support tickets to find out what your customers actually want.
A Founder's Guide to Analyzing Survey Data
A battle-tested approach to analyzing survey data. Learn how to turn raw feedback into actionable insights that drive real business decisions.
You're sitting on a pile of survey responses and you think you're about to uncover genius insights. You're not. You're about to be lied to by a mob of the angriest and most bored people who use your product.
Ignoring this fact isn't just a mistake; it's how you go bankrupt while clutching a pie chart that says "70% satisfied." You're not analysing survey data; you're building a business on top of a sinkhole of vanity metrics, polite lies, and rage-clicks from people who will churn tomorrow.
This guide isn't about "the importance of listening." It's about how to stop being a sucker.
Takeaway: Stop treating survey data as gospel. Treat it like a hostage negotiation—everyone has an agenda, and the truth is buried under layers of bullshit.
Step 1: Clean Out the Garbage (And Most People Are Garbage)
Before you even think about a pivot table, you have to do the digital equivalent of janitor work. Your raw survey data is a toxic waste dump of bots, speed-clickers, and people who answered "5" to every question because they wanted the $10 Amazon gift card.
Skipping this step is like building a skyscraper on a foundation of soggy cardboard. Your "insights" will be complete fiction, and you'll waste months of engineering time building features for ghosts.
Be ruthless.
| The Offender | What It Looks Like | Why It's Garbage | What to Do |
|---|---|---|---|
| The Straight-Liner | Answered '5' for every single question. | They're just clicking to finish. Their feedback is a lie. | Delete it. |
| The Speed Demon | Finished your 10-minute survey in 30 seconds. | Didn't read a single word. | Delete it. |
| The Gibberish-Talker | The open-ended box says "asdfghjkl." | Bot or troll. Zero value. | Delete it without mercy. |
| The Contradictor | Rates you 1/10 but writes, "I love everything!" | Their data is schizophrenic and untrustworthy. | Delete it. |
This isn't about being mean; it's about intellectual honesty. Every bad response you keep is a lie you're telling yourself about your business.
This chart isn't a suggestion. It's a law. Garbage in, garbage strategy out.
Then there's weighting. If your customer base is 50/50 male/female but your survey is 90% male, you're not getting customer feedback—you're getting a men's focus group. You have to adjust for this using tools like SPSS or R, or you're making decisions based on a funhouse mirror reflection of your market. To get real, unfiltered answers, you need to master your event feedback form from the start.
Takeaway: Your data is guilty until proven innocent; kill the bad stuff before it kills your company.
Step 2: Stop Admiring Averages, Start Slicing Throats
You’ve cleaned the data. Great. Now for the part where 99% of founders screw up. They look at the average satisfaction score, see a "7/10," and think, "Not bad!"
That's not an insight. It's a sedative.
The average is a myth. It’s like saying the average hospital patient is half-sick and half-healthy. It tells you nothing. The real story, the one that makes you money, is in the extremes and the segments. The magic is in cross-tabulation—pitting one group against another in a fight to the death.
Stop looking at one number and start comparing two.
- NPS vs. Price Plan: Your highest-paying enterprise customers have a lower NPS than your free-tier users? You don't have a product problem; you have a "your-business-is-on-fire" problem.
- Satisfaction vs. Feature Usage: Users who touch your new AI feature are twice as happy? Stop debating the roadmap and shove that feature down everyone's throat in onboarding.
- Churn Risk vs. Acquisition Channel: Users from Google Ads churn 3x faster than users from organic? You’re lighting piles of cash on fire to attract the wrong people. Kill the campaign.
This isn't just about surveys; it's about understanding what your Shopify data is really telling you beyond just top-line revenue.
This is how you turn data from a report card into a weapon. Don't create pretty charts—that comes later. We have a guide on data visualization best practices for when you need to impress the board. For now, find the ugly truth in the numbers. For a historical example, see how these major societal trends were tracked using the same principles.
Takeaway: Averages are for amateurs; real founders find the one segment that’s bleeding out and fix it.
Step 3: Unleash the Machines on Open-Ended Text

The numbers tell you what. The open-ended text tells you why. It's also a founder's personal hell—a swamp of typos, rants, and feature requests scrawled on digital napkins.
If you are manually reading and tagging thousands of comments, you are failing at your job. Your time is worth more than that. Your job isn't to be a human spreadsheet; it's to make decisions. Use machines.
Natural Language Processing (NLP) tools aren't magic. They're just brutally efficient clerks. They read everything, count everything, and stack it into neat piles: "login issues," "pricing complaints," "dark mode requests." To get the basics, learn what text analysis actually is.
Your brain is for context and nuance. The machine is for brute force. Use both. Let the algorithm tell you that 27% of negative feedback mentions "slow." Then, you go read a dozen of those specific comments to feel the user's pain.
| Situation | Who You Use | The Blunt Reason Why |
|---|---|---|
| <100 comments | You (Manual) | You need the empathy. Feel the pain yourself. |
| >100 comments | The Machine (NLP) | Don't be a hero. Your time is too expensive for this grunt work. |
| Need nuance/sarcasm | You (Manual) | Machines are still dumb and can't tell if a user is joking or homicidal. |
| Need speed/scale | The Machine (NLP) | It will do in 5 minutes what would take you 5 days. |
The machine finds the fire. You find the arsonist.
Takeaway: Stop reading every comment like it's a love letter; let a machine count the complaints so you can focus on fixing them.
Step 4: Stop Reporting, Start Arming Your Teams
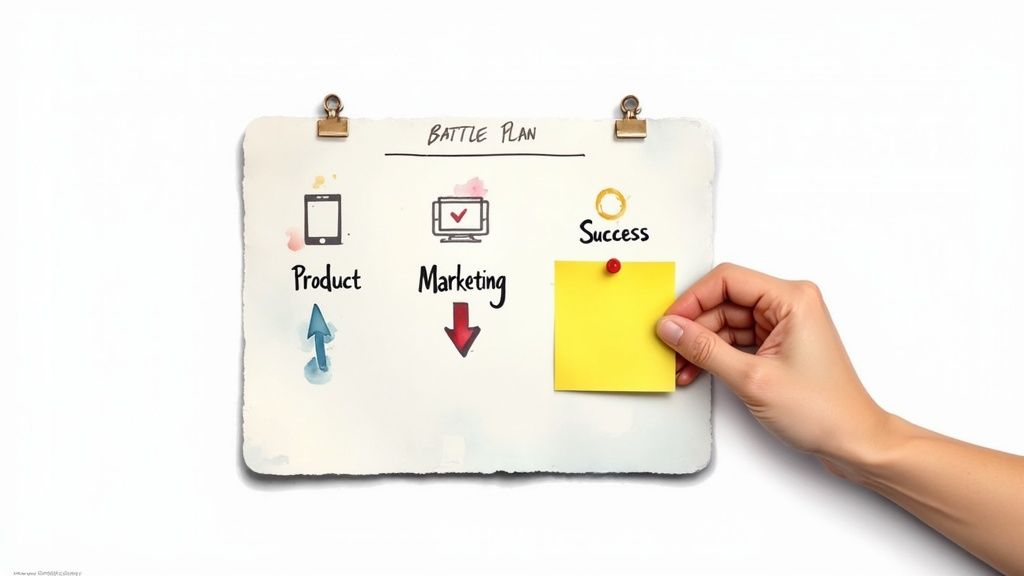
So you have insights. Whoop-de-doo. An insight that doesn't lead to action is just expensive trivia.
"25% of users are unhappy" is not an insight. It's a useless fact.
"Our highest LTV customers are churning at 3x the average rate because the iOS app is slow" is an insight. It's a goddamn battle plan.
Your job isn't to make a PowerPoint. It's to arm your teams with specific orders. Don't just forward a spreadsheet—that's lazy and guarantees nothing will happen. Translate your findings into their language.
- To Product: "Our best users are churning because the app is slow. Hypothesis: If we cut load time by 50%, we'll cut churn in that segment by 15% this quarter. Build it."
- To Marketing: "Customers using Feature X have a 40% higher NPS. Build a campaign that screams about Feature X. We're leaving money on the table."
- To Customer Success: "The top complaint is the 'confusing checkout.' I wrote a new help doc. Use it. This should cut related tickets by 30%."
Every recommendation must have three parts, or it's just complaining:
- The Insight: What's broken and why it matters (e.g., "Detractors are 4x more likely to mention bad support.")
- The Action: What to do, specifically (e.g., "Implement a 24-hour response time SLA for paying customers.")
- The Outcome: The metric you'll move (e.g., "This will cut paid churn by 5% in 6 months.")
Takeaway: If your analysis doesn't end with a list of ass-kicking action items for each department, you failed.
Stop Whining and Get to Work
Quit hiding behind "we need more data." The questions that paralyze most founders are just excuses for inaction.
- How big a sample size? Big enough to make a less stupid decision than you would without it. For finding glaring problems, 50 responses is plenty. Stop obsessing.
- What if data conflicts? Good. It means you've found something interesting. Trust what users do over what they say. Your analytics are your ground truth.
- How often to survey? As little as possible. Every survey you send better have a damn good reason for existing. If you can't name the decision it will influence, don't send it.
Analysing survey data isn't a science experiment. It's a street fight. You get in, find the weak spot, hit it hard, and get out.
Stop playing detective with spreadsheets and let Backsy’s AI show you exactly where the money is hiding in your customer feedback.