Customer Retention Metrics: The No-BS Guide for Founders
Stop guessing. Learn the essential customer retention metric formulas and strategies to turn your data into predictable, long-term business growth.
Posted by
Related reading
Stop Guessing Churn. Use This Simple Calculator to See How Much Money You’re Burning
Your churn isn’t a mystery. Use this simple churn cost calculator to see how much revenue you’re losing every month—and how better feedback analysis can win it back.
Your Growth Is A Lie. Here's The Math That Proves It.
Stop bleeding users. Learn how to calculate, benchmark, and actually improve your customer retention rate with no-BS strategies that prevent churn.
Your Customer Experience Dashboard Is Lying To Your Face
Stop trusting vanity metrics. Build a customer experience dashboard that reveals hard truths about churn, retention, and revenue. A founder's guide.
Here’s the TL;DR in 20 seconds. Stop chasing vanity metrics. These are the three numbers that actually tell you if your business is alive, dying, or ready to print money.
- Customer Retention Rate (CRR): Are people sticking around? This is your basic "leaky bucket" test. A high CRR means your product isn't actively pushing people away.
- Customer Lifetime Value (CLV): How much is a customer worth? This number tells you how much you can afford to spend to get a new customer without going broke. If your CLV isn't 3x your acquisition cost, you have a problem.
- Net Revenue Retention (NRR): Is your existing customer base a growth engine? This is the holy grail for SaaS. An NRR over 100% means you're making more money from existing customers than you're losing from churn. It means you can grow even if you stop acquiring new customers.
Calculating Your Foundational Retention Metrics
Abstract ideas don't pay the bills. It's time to stop talking about retention and start doing the math. These are the core calculations that reveal the unfiltered truth about your company's health. Think of them less as numbers and more as vital signs—the data that tells you if you're growing, stagnating, or in trouble.
This flow chart shows how these key retention metrics build on one another, moving from simply counting customers to understanding their total financial impact over time.
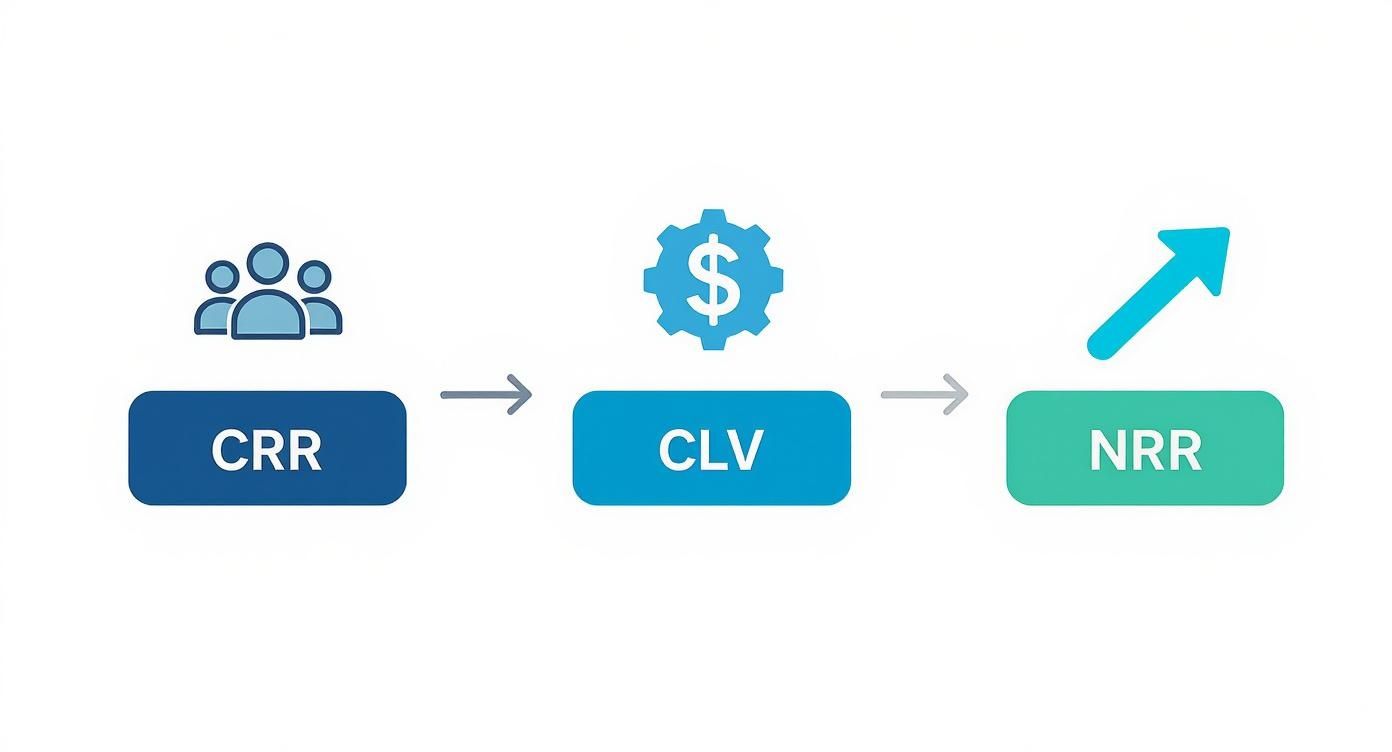
Starting with CRR gives you a baseline for loyalty. That loyalty directly informs the long-term potential captured by CLV, and ultimately, the sustainable growth measured by NRR.
Customer Retention Rate (CRR): The Simplest Truth
Your Customer Retention Rate (CRR) is the most direct measure of loyalty you have. It answers one simple question: "Of all the customers we had at the start of the month, how many were still with us by the end?" It’s your first line of defense against a leaky bucket.
The formula is brutally honest:
CRR = [ (Customers at End of Period - New Customers Acquired) / Customers at Start of Period ] x 100
Real-World Example: Imagine your SaaS business kicked off January with 1,000 customers. By the end of the month, your customer count was 1,150. During January, you also brought in 200 brand new customers.
- Calculation:
- Ending Customers: 1,150
- New Customers: 200
- Starting Customers: 1,000
- CRR = [ (1,150 - 200) / 1,000 ] x 100 = 95%
A 95% monthly retention rate tells you that you successfully kept 950 of your original 1,000 customers. If you want to dive deeper into the nuts and bolts, this guide on how to calculate your customer retention rate is a great resource.
Actionable Takeaway: Track your CRR every single month. If that number starts to drop, you have a product or service problem on your hands that no amount of marketing spend can fix. It’s the earliest warning sign you’ll get.
Customer Churn Rate: The Necessary Evil
Churn Rate is just the flip side of the retention coin. It measures the percentage of customers who bailed on you during a specific period. While CRR tells you who stayed, churn screams about who left—and you absolutely need to listen.
The formula is just as straightforward:
Churn Rate = (Customers Lost / Customers at Start of Period) x 100
Real-World Example: Sticking with the same scenario, you started with 1,000 customers and ended with 1,150 after signing up 200 new ones. Back-of-the-napkin math shows you lost 50 customers along the way (1,000 + 200 - 1,150 = 50).
- Calculation:
- Customers Lost: 50
- Starting Customers: 1,000
- Churn Rate = (50 / 1,000) x 100 = 5%
See how that works? Your 95% retention rate plus your 5% churn rate equals 100%. The real work begins when you start digging into why that 5% churned. That often requires powerful customer feedback analysis tools to get to the root cause.
Actionable Takeaway: Don't just track churn; obsess over the reasons for churn. A 5% churn rate isn't a number, it's a story about 50 people who decided your product wasn't worth it anymore. Find out why.
Customer Lifetime Value (CLV): The Long Game
Customer Lifetime Value (CLV) elevates the conversation from "how many customers did we keep?" to "how much is each of those customers truly worth?" It’s a projection of the total revenue you can expect from a single customer over the entire course of your relationship. This number should dictate your marketing budget, your sales strategy, and your entire growth plan.
Here's a basic way to calculate it:
CLV = Average Purchase Value x Average Purchase Frequency x Average Customer Lifespan
Real-World Example: Let's say your average customer pays you $50/month. From your data, you know that, on average, a customer sticks around for 36 months.
- Calculation:
- Average Purchase Value: $50
- Average Purchase Frequency (per month): 1
- Average Customer Lifespan: 36 months
- CLV = $50 x 36 = $1,800
That $1,800 figure is pure gold. It tells you that you can spend up to that amount to acquire a similar customer and still break even over their lifetime. This is why retention pays. Acquiring new customers is expensive—about five times more than keeping an existing one. Plus, repeat buyers spend 67% more. Some studies show a tiny 5% bump in retention can boost profits by as much as 95%.
Actionable Takeaway: Your CLV must be significantly higher than your Customer Acquisition Cost (CAC). If it’s not, your business model is fundamentally broken. A healthy CLV:CAC ratio is generally considered to be 3:1 or better.
Moving Beyond Headcounts to Revenue Retention
Customer Retention Rate (CRR) is a fantastic starting point. But it has a major blind spot: it tells you if you're keeping customers, but not if you're keeping the right ones. It's entirely possible to have a sky-high CRR while quietly losing your most valuable accounts. You might be left with a large group of low-value, high-maintenance users, and your top-line metric wouldn't even flinch.
This is where you need to get smarter. The real game isn't just about counting heads; it's about the revenue those heads represent. Shifting your focus from simple customer retention to revenue retention is the difference between running a business and building a true financial engine.
The Power of Revenue-Based Metrics
This is where two crucial metrics come into play: Gross Revenue Retention (GRR) and Net Revenue Retention (NRR). Both measure your ability to hold onto revenue from a specific group of existing customers, completely ignoring any new business you've signed.
- Gross Revenue Retention (GRR): Think of this as your revenue defense score. It shows how much of your starting recurring revenue you kept after accounting for churn (cancellations) and downgrades. By definition, it can never go above 100%.
- Net Revenue Retention (NRR): This is the metric SaaS investors obsess over, and for good reason. It starts with GRR and then adds back any expansion revenue you've generated from that same group of customers through upgrades, add-ons, or cross-sells. A healthy NRR can soar well over 100%, signaling that your existing customer base is a growth engine all on its own.
CRR vs. NRR: A Tale of Two Companies
Let's imagine two SaaS companies, Company A and Company B. They look almost identical on the surface. Both start the year with 100 customers and $100,000 in Monthly Recurring Revenue (MRR).
| Metric | Company A (High CRR, Low NRR) | Company B (Lower CRR, High NRR) |
|---|---|---|
| Starting Customers | 100 | 100 |
| Churned Customers | 5 (5%) | 10 (10%) |
| Customer Retention Rate | 95% | 90% |
| Starting MRR | $100,000 | $100,000 |
| Lost MRR (from churn) | $5,000 | $10,000 |
| Expansion MRR | $2,000 | $25,000 |
| Ending MRR | $97,000 | $115,000 |
| Net Revenue Retention | 97% | 115% |
At first glance, Company A looks great with its 95% CRR. They’re masters at keeping customers from leaving. But look closer—their revenue is actually shrinking. They're retaining customers, but those customers aren't growing with them.
Company B, despite a lower 90% CRR, is in a much stronger position. Sure, they lost more customers, but the ones who stayed loved the product so much they upgraded in a big way. Their 115% NRR shows they have a powerful engine for organic growth. Company B is the business investors would be lining up to fund. To drive that kind of expansion, you first have to deeply understand what your best customers actually want. Learning how to get customer feedback is the essential first step.
Actionable Takeaway: Stop obsessing over customer headcounts alone. Start calculating your NRR every single month. If it's consistently below 100%, your business has a leaky bucket that a flood of new customers can't permanently fix.
Why Your Blended Retention Metrics Are Lying
A single, company-wide retention number is the ultimate vanity metric. It might look decent on a PowerPoint slide, but it tells you almost nothing about the actual health of your business. It's like checking the average temperature of a hospital ward—one patient could be freezing while another is running a raging fever, but the average looks perfectly fine.
This dangerous averaging hides the real story. The truth isn't found in the total; it's buried in the segments.

Unmasking the Truth With Segmentation
Segmentation is breaking down your customer base into smaller, more meaningful groups. Stop looking at "all customers" and start zooming in.
You can segment by almost anything:
- Acquisition Channel: Are customers from Google Ads stickier than those from organic search?
- Initial Plan Type: How does the retention of your 'Pro' plan users compare to those on the 'Basic' plan?
- Geography: Do users in North America churn at a different rate than users in Europe?
- User Behavior: What’s the retention rate for users who adopt a key feature versus those who don't?
By doing this, you stop flying blind. You start pinpointing exactly where your business is winning and where it's bleeding out.
The Misleading Average: A Real-World Example
Let's imagine a SaaS company with a blended monthly retention rate of 70%. Not great, but it probably doesn’t set off any five-alarm fires. But then, the founder segments by initial plan type and uncovers a shocking reality:
- Enterprise Customers: These high-value accounts have a stellar 95% retention rate. They are happy, stable, and drive most of the revenue.
- Freemium-to-Paid Users: This group, acquired through a free plan, has a disastrous 20% retention rate. They are churning at 80% every single month.
The blended 70% was a lie. It was masking a thriving enterprise business and a completely broken freemium funnel. Without segmentation, they would have kept pouring resources into a channel that was actively destroying value. As this deep dive into retention benchmarks shows, what's considered "good" is entirely dependent on your market and customer segment.
Actionable Takeaway: A blended customer retention metric is worse than useless; it's actively misleading. It averages out your biggest successes and your most catastrophic failures into a single, mediocre number that paralyzes good decision-making.
How to Actually Improve Your Retention Metrics
Metrics are just numbers on a dashboard until you do something about them. Watching your retention rate dip is frustrating, but it's useless unless you understand the why behind the drop.
More often than not, the single biggest reason retention metrics tank is a failure to truly listen to your customers. All that qualitative feedback—the messy, unstructured comments from surveys, support tickets, and reviews—is a direct roadmap to plugging the leaks in your business.
Metrics tell you what is happening. Feedback tells you why.

The secret isn't just gathering more data. It’s about turning that mountain of feedback into a short, prioritized list of actions that will actually move the needle.
Identify and Quantify Your Churn Drivers
Your first job is to hunt for the recurring themes in the feedback from customers who have already left. You're looking for patterns—the same problems popping up again and again.
Here’s how to do it:
- Aggregate Your Feedback: Pull everything into one place. Support chat logs, NPS comments, App Store reviews, cancellation survey responses—the works.
- Tag and Categorize: Start tagging the feedback by theme. You'll see churn drivers fall into buckets like "Missing Features," "Poor User Experience," "Pricing Issues," or "Bugs/Performance."
- Count the Mentions: Count how many times each theme appears in feedback from your churned customers. This turns qualitative complaints into quantitative priorities.
Suddenly, you have hard data showing that 35% of churned users mentioned the "confusing dashboard" and 20% complained about "slow loading times." Now you know exactly where to point your resources for the biggest impact. If you need a hand organizing these themes, our guide on how to improve NPS offers some frameworks that work for all kinds of feedback.
Real-World Example: Turning Feedback into Retention
Imagine a B2B SaaS company struggling with a high churn rate in the first 30 days. Their CRR looked decent, but a cohort analysis revealed a major leak right at the start.
Instead of guessing what new features to build, they dove deep into the open-ended feedback from every single user who canceled within their first month.
Using a simple feedback analysis tool, they aggregated and tagged all the comments. A powerful theme jumped out almost immediately: over 40% of churned users used words like "confusing," "overwhelming," or "couldn't figure out where to start" when describing the user interface.
The problem wasn't a lack of features; it was a disastrous onboarding experience.
Armed with this insight, the team paused all new feature development. They went all-in on redesigning the first-run user experience, adding a guided setup wizard and simplifying the main dashboard.
The result? First-month retention jumped by 15% the very next quarter. They didn't build a single new feature. They just listened to what their churning customers were practically screaming at them. This link between experience and retention is real; poor customer service costs U.S. businesses $75 billion a year. Improving experience, for example, via a well-implemented CRM for telecommunications, can drive massive growth.
Actionable Takeaway: Your customer feedback isn't a suggestion box; it’s a churn diagnostic tool. Find the most common complaint among your lost customers, fix it, and watch your retention metrics climb.
Frequently Asked Questions About Retention Metrics
Here are the questions that trip up founders when they get serious about retention.
What is a good customer retention metric?
There's no magic number. A "good" customer retention metric depends entirely on your industry, business model, and age. For SaaS, over 90% annually is strong. For e-commerce, a 35% repeat purchase rate is excellent. The only benchmark that truly matters is your own historical data. Your goal should be to consistently improve your own past performance.
How often should I measure retention metrics?
The cadence depends on your business rhythm.
- SaaS/Subscriptions: Track metrics monthly. This is frequent enough to spot trends early without panicking over daily noise.
- E-commerce/Consulting: A quarterly review is often more practical, smoothing out short-term fluctuations to reveal long-term patterns.
What is the difference between customer retention and loyalty?
They aren't the same thing.
- Retention is a behavior. It’s a black-and-white metric: did the customer stay or leave?
- Loyalty is an attitude. It’s about how a customer feels. A loyal customer advocates for you and forgives mistakes.
High retention without loyalty means you have customers who are just waiting for a better offer to come along.
What is the most important customer retention metric?
For most subscription-based businesses (especially SaaS), Net Revenue Retention (NRR) is the king. While CRR tells you if you're keeping customers, NRR tells you if your relationship with those customers is getting more valuable over time. An NRR over 100% is the ultimate sign of a healthy, scalable business with a sticky product.
What are the 3 types of customer retention?
While there are many ways to slice it, a practical way for founders to think about retention is in three stages:
- Early Retention: Keeping new users past the critical onboarding phase (e.g., first 7-30 days). This is all about delivering on your initial promise, fast.
- Mid-Term Retention: Turning casual users into habitual users. This is where they integrate your product into their regular workflow.
- Long-Term Retention: Creating loyal advocates who not only stick around but also expand their usage and refer others.
Why is customer retention the most important metric?
Because it's cheaper and more profitable than acquisition. Acquiring a new customer can cost 5x more than retaining an existing one. Furthermore, increasing customer retention by just 5% can boost profits by 25% to 95%. It's the foundation of sustainable, profitable growth, proving you've built something people actually value.
If you don't know why customers are churning, all the retention metrics in the world won't save you. Backsy analyzes your customer feedback to show you the receipts.
Internal Link Recommendations:
- Anchor: customer feedback analysis tools
- Anchor: how to improve NPS
- Anchor: how to get customer feedback