You’re Building a Product Nobody Wants. Here's How to Fix It.
Master coding data for qualitative research to turn messy feedback into actionable insights and a clear product roadmap.
Posted by
Related reading
Transforming Customer Feedback Analysis with AI in Real-Time
Discover how AI revolutionizes customer feedback collection and analysis, enabling swift, informed decision-making for businesses.
10 Voice of Customer Examples You Can Actually Use
Stop guessing. See 10 real voice of customer examples from surveys, social media, and support tickets to find out what your customers actually want.
A Founder's Guide to Analyzing Survey Data
A battle-tested approach to analyzing survey data. Learn how to turn raw feedback into actionable insights that drive real business decisions.
Let’s be honest. That folder of survey responses and Intercom chats you’re so proud of? It’s a liability. It’s a noisy, biased pile of text that’s actively encouraging you to build features for an audience of one: yourself.
Most founders either ignore this feedback or cherry-pick the one comment that confirms what they already believe. Both paths lead to the same graveyard. Ignore what your customers are really saying, and you’ll be lucky to survive the quarter.
The only way to turn that qualitative mush into a product that actually prints money is by systematically coding it. This isn't some MBA homework assignment; it's battlefield triage. It’s how you translate a vague complaint like "the UI is confusing" into a specific, actionable ticket like "Onboarding Step 3 - Missing Tooltip."
This visual shows the only process that matters: turning messy opinions into a clear job for your team.
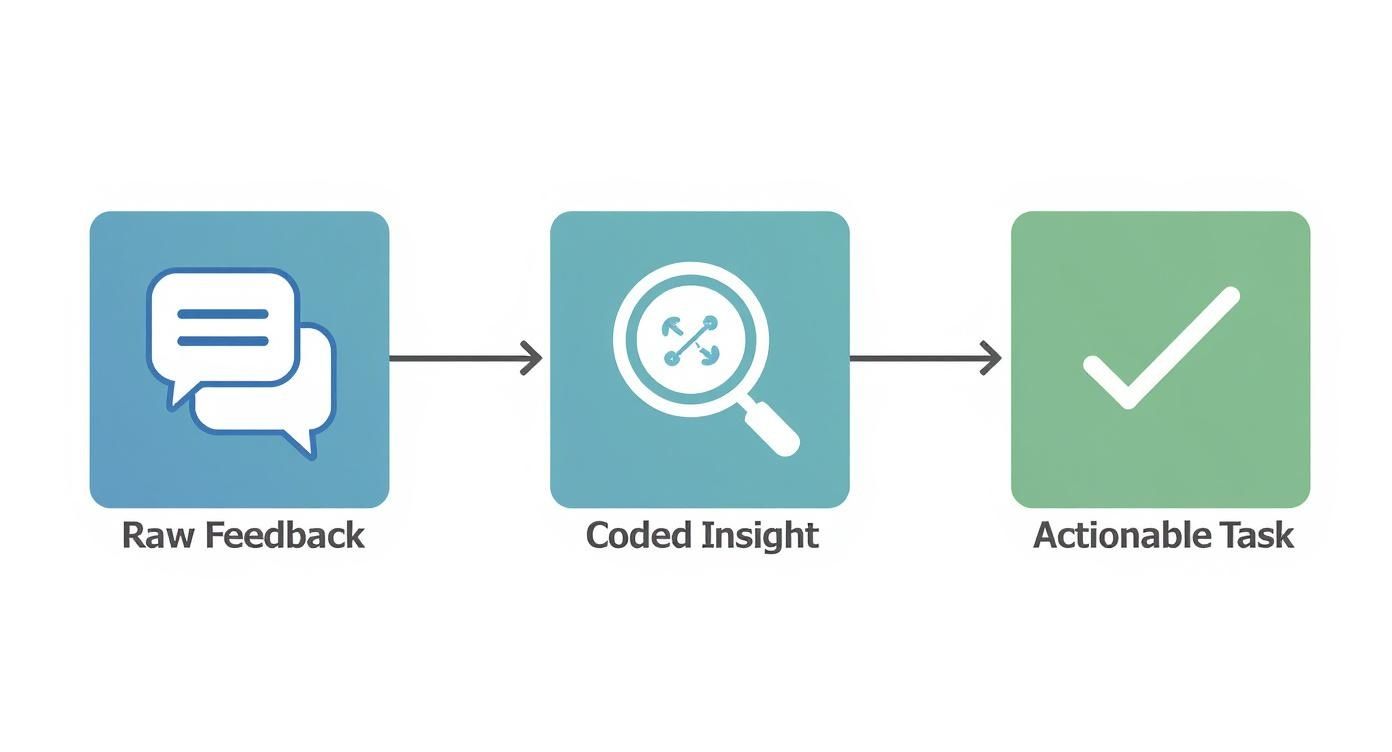
This process forces raw opinions through a filter. What comes out isn't noise—it's a specific job to be done.
Stop Hearing What You Want to Hear
This isn't about "listening to customers." It’s about decoding their raw, unfiltered feedback into a treasure map that points directly to what they will pay you for.
It forces you to be ruthlessly objective. You have to stop hearing what you want to hear and start seeing the real patterns—the frustrating bugs, the hidden feature requests, and the actual reasons people are churning. Every piece of uncoded feedback is a landmine on your roadmap. You can either step on it or take the time to disarm it.
Takeaway: Your feedback is a liability until you systematically decode what customers are actually telling you.
From Vague Whining to Actionable Tasks
Coding data for qualitative research is what separates founders who build momentum from those who just spin their wheels.
- Before Coding: "Users think our app is hard to use." This is useless. It's a feeling, not a problem. You can't assign it to an engineer.
- After Coding: "34% of onboarding drop-offs are linked to confusion around the 'Project Setup' screen, with 12 mentions of the 'Invite Team Member' button being unclear." Now that's a directive. It's a specific, quantifiable problem your team can actually solve.
These decoded data insights can help reduce customer churn and build a product people refuse to leave. This isn’t about making your product better; it's about making your decisions better.
Takeaway: Translate vague complaints into specific, quantifiable problems or you're just gambling with your runway.
Your Data Needs Triage, Not Analysis

Forget "analyzing data." You're performing battlefield triage. It's messy, it's urgent, and the goal isn't perfection—it's survival. If you treat every piece of feedback with the same reverence, you'll burn through your resources fixing papercuts while the patient bleeds out.
This isn't about building an elegant taxonomy for a research paper. It’s about quickly sorting the "we're about to churn" issues from the "this button could be a different shade of blue" annoyances.
Phase 1: The Brutal First Pass
This is fast and shallow by design. Your only goal is to slap a high-level label on everything. Read a piece of feedback and ask: "What is this generally about?" Pricing? Bugs? A feature request? Don't overthink it.
- Don't write: "User is struggling with the value proposition of the Pro plan."
- Just write: "Pricing"
You’re just sorting things into piles. If you're spending more than 15 seconds on one comment, you're doing it wrong. Momentum is everything.
Phase 2: The Granular Breakdown
Now, go back through your piles and get specific. The "Bugs" pile isn't one problem—it’s a dozen different failures. Your job is to break them down.
"Bugs" becomes "Mobile Login Failure," "Dashboard Chart Error," and "CSV Export Timeout." You're moving from general symptoms to specific diagnoses. Your codebook starts here. It’s not some fancy document; it’s a gritty, evolving dictionary of your customers' actual problems.
Let the codes emerge from the data. If you believe your onboarding is brilliant but the data screams "Onboarding Hell," your opinion is irrelevant. The data is the boss. Over 78% of research teams now use software for this—if you’re curious, explore a deeper reflection on these technological shifts to see how far the tools have come.
Phase 3: The Pattern Synthesis
You've broken everything down. Now, you build it back up. This is where you zoom out and the real insights click into place.
Suddenly, you’ll notice that 30% of your 'Bug' codes are all related to the same broken checkout flow. You'll realize that the scattered 'Feature Requests' for "better reporting" and "custom exports" all point to a single, underlying job your product is failing at. This is messy. You'll argue with your co-founder about whether "Slow Loading Time" is a bug or a performance issue. Good. That’s the work.
Takeaway: Triage, don't analyze. Sort feedback into broad piles, then specific problems, and finally, connect the dots into powerful themes.
Manual vs. AI Coding: The Scalpel and The Excavator

Arguing about manual vs. AI coding is a waste of time. It's like arguing if a construction crew needs a shovel or an excavator. You use the right tool for the job. Get this wrong, and you'll be digging a foundation with a teaspoon or demolishing a wall you only meant to repaint.
Manual coding is your scalpel. You use it for precise, high-stakes surgery on a small dataset—your first 20 user interviews or feedback from your five biggest customers. This is where you get your hands dirty and develop a founder's intuition that no machine can replicate.
But if you try to manually code 10,000 survey responses, you're not a hero; you're a martyr. Your business will die from analysis paralysis long before you find any insights.
The Brute-Force Machine
AI is your excavator. It tears through thousands of app reviews and support tickets in minutes, giving you a high-level map of the landscape. It does the grunt work that would take a human researcher weeks.
But you can't trust an excavator for fine-finishing. An AI might code "I wish the price was lower" and "Your pricing is a total rip-off" under the same "Pricing" theme. Technically correct, but it misses the critical difference in urgency. One is a suggestion; the other is a churn warning. Blindly trusting AI here is like thinking a whisper and a scream are the same thing. To survive, you need to understand the nuances found in the best sentiment analysis tools.
The Hybrid Approach Wins. Every Time.
The only winning move is a hybrid approach. The machine finds the what, and you find the why. The GRIT Report found that while 45% of market research firms use AI, 68% of researchers prefer a hybrid model. They want machine speed with human oversight.
Here’s the workflow:
- Unleash the AI: Feed it the massive dataset. Let it do the heavy lifting and surface the big themes, like "22% of feedback is about 'UI issues'."
- Human Intervention: Now you, the founder, dive into that "UI issues" bucket. You use your scalpel to find the nuance the AI missed—the angry rants, the desperate pleas, and the brilliant suggestions.
This gives you the scale of the excavator and the precision of the scalpel. Tools like AI meeting note takers can streamline the initial data capture, bridging the gap between raw conversation and coded insight.
Takeaway: Use AI as an excavator for scale and your brain as a scalpel for nuance.
How to Stop Lying to Yourself with Data
The easiest person to fool is yourself. Your entire analysis is worthless if it’s just an elaborate exercise in confirmation bias. You are hardwired to find patterns that prove you were right all along, and that instinct will kill your product.
You need a kill switch for your own bad ideas.
Academics call it "intercoder reliability." I call it a brutal gut check. Grab your co-founder or lead engineer—anyone who will call you on your B.S.—and have them code a random sample of the same data. Without seeing your codes.
Then, compare notes.
If you coded a comment as "User Needs Better Onboarding," but they coded it as "User is Frustrated with a Specific Bug," your definitions are sloppy and you’re seeing what you want to see. This isn’t about hitting an 80% agreement score. It’s a smoke test. If two smart people can’t agree on what a customer is saying, you don't understand your market.
This forces you to build a brutally clear codebook—your company’s dictionary for customer pain.
- Weak Definition: "UI Issues" (Useless)
- Strong Definition: "UI/UX - Navigation Confusion" - User comments about being lost, unable to find features, or uncertainty about how to get back to a previous screen. Example: "I couldn't figure out how to get back to my dashboard."
Skipping this is like a pilot ignoring their pre-flight checklist. It's pure arrogance. Research shows teams that do this hit 87% agreement, a massive leap from the 68% who don't. Read the full study on qualitative data methods if you think I'm making this up.
Takeaway: Force a teammate to code the same data to stop you from seeing only what you want to see.
Turning Insights into Shipped Code

So you have a perfectly coded spreadsheet. Right now, it’s worth nothing.
A pile of coded data is just potential energy. It’s lumber before you build the house. The final, most critical step is translating those abstract themes into concrete roadmap items. Most teams drop the ball here. They present a beautiful report, everyone nods, and then… nothing changes. The insights die in a PowerPoint slide.
Don't let this happen. This is the only mile that matters.
The Number, The Quote, The Task
For every major theme from coding data for qualitative research, you need three things. If you can't find them, the theme isn't ready.
- The Number: How many people mentioned this? Quantify the pain.
- The Quote: What’s the most visceral soundbite that captures the feeling?
- The Task: What is the absolute smallest, most immediate next action?
This trinity is the bridge from abstract analysis to shipped code.
Make the Pain Impossible to Ignore
Let's get tactical.
1. The Number
Your gut feeling is worthless. "Checkout Flow Errors" is weak. "27% of all support tickets last month were related to checkout flow errors, costing us 40 hours of support time" is a fire alarm. Numbers cut through the noise.
2. The Quote
Data removes emotion. Your job is to put it back. Find the single most painful, visceral quote that represents the theme. Don't sanitize it. Slap "I almost threw my laptop out of the window trying to give you my money" on top of the Jira ticket. It reminds your engineers they aren’t just closing a task; they are solving a real human’s problem. A number makes the problem significant. A quote makes it personal.
3. The Task
"Redesign Checkout" is not a task. It's a six-month death march. Break it down until it's laughably small.
- Bad Task: Redesign Checkout Flow
- Good Task: "Investigate API logs for payment gateway timeouts from the last 7 days."
- Good Task: "Design a single-field input for the credit card form."
This closes the loop from customer pain to shipped code. To get serious, build a battle-tested feature prioritization framework that stops you from just working on the loudest problem.
Takeaway: Arm every insight with a number for impact, a quote for empathy, and a tiny task for momentum.
Founder FAQs on Qualitative Coding
Alright, let's cut the crap. You see the potential but still have questions. Here are the honest answers.
This sounds like a ton of work. Is it really worth it?
Is building a product people abandon after two weeks worth it? This isn't "extra work"—it's the real work. The alternative is operating on gut feelings, which is the most expensive mistake any startup can make. Spending 20 hours coding feedback to save three months of engineering time on a feature nobody wants is the best ROI you'll ever get. You can either decode what customers are telling you, or you can spend your runway building a beautiful product nobody will pay for. Your choice.
When do I have enough data to start?
Now. If you have ten support emails or one recorded user interview, you have a starting point. Don't wait for some mythical "statistically significant" dataset. That’s for academics. You're hunting for painful, recurring themes, not statistical proof. You’ll be amazed at the clarity that comes from just a handful of conversations. Stop waiting and start coding.
Can’t I just use a multiple-choice survey?
Sure, if you want clean charts that tell you nothing new. Multiple-choice questions are great for validating what you already suspect, but they are a terrible tool for discovery. They're a confirmation bias machine. The real gold isn’t in the radio buttons. It's buried in the messy, open-ended "anything else to add?" text boxes. Coding data for qualitative research is how you mine that gold. Quantitative data tells you what is happening; qualitative tells you why. You need both to win.
What’s the one tool you’d actually recommend?
A spreadsheet. No, really. It’s free, it’s flexible, and it forces you to actually think. When it starts to creak under the weight of the data, graduate to something smarter. For a hybrid approach that uses AI for the heavy lifting without stripping your control, a tool like Backsy.ai is built for this exact workflow. But don't get hung up on the tool. Start with the data you have. The insights are waiting.
Stop letting customer feedback rot in a spreadsheet and start turning it into your unfair advantage with Backsy.ai.